Case Study
Sustainability Report: Bending the Curve - An Approach to Radically Cut Emissions From the Building Industry
At Handel Architects, we believe that architecture and design matter – that through our work, we can make a difference in the world. We believe that each project should not just be seen as a thing in itself, but as a catalyst for positive urban and social change.
Rapidly rising human population growth coupled with a legitimate demand for a higher standard of living is placing increasing demand on planetary resources. Dense, diverse, culturally rich urban environments coupled with new innovative sustainable technologies will allow us to offer people a better, healthier standard of living while utilizing radically less energy. Our goal is to be part of that solution.
In this piece we discuss the opportunities that designing to Passive House standards can provide. Since buildings account for a large part of the world's carbon output, implementing Passive House can be a significant tool in combating global warming.
World energy-related carbon dioxide emissions (Greenhouse Gas Emissions)
Climate scientists estimate that by the year 2042, the atmosphere will reach CO2 concentration of over 450 parts per million (ppm). The hypothesis is that the Earth’s average temperature will have increased past the 3.5-degree Celsius barrier and that the 450 ppm will prevent the temperature from decreasing. They have labeled this the “point of no return” and believe the effects would be irreversible.

Overlaying the projected growth in world population with the EIA 2020 CO2 projections, you can see that the forecast is dire.
It is not enough to focus on personal carbon footprints, the sustainability of the human species living on this Earth require structural changes to our energy sources, cultural attitudes, and the practices we use to construct our built environment. We must bend the curve away from this point of no return.
Real Evidence: Massive Arctic Ice Loss
This is not mere conjecture, there is direct evidence of anthropomorphic climate change. One of the most notable is the demonstrated shrinking of the ice caps and glaciers, especially alarming considering that according to the UN 2.4 billion people (over 40% of the world population) live within 60 miles of the oceans.

Intergovernmental Panel on Climate Change (IPCC)
The Intergovernmental Panel on Climate Change (IPCC) have laid out some paths forward and benchmark goals to reduce greenhouse gas and carbon emissions. Their pathways require immediate and broad transitions to enact structural changes to the energy, land-use, urban, transportation, building, and industrial systems.

Greenhouse Gas Emissions in New York City (2018)
Zooming in from the global perspective to the city, let’s look at the impact of buildings on greenhouse gas emissions focusing on New York City. The chart below shows the overall GHG emissions for the city. Notice that all buildings account for over 67% of the emissions, and residential buildings specifically account for 34%.

Making buildings even a little bit more efficient will have an out-sized result in reducing carbon emissions for the city.
In 2019, the NYC City Council implemented a series of carbon reduction laws, focusing mostly on the reduction of GHG emissions. Some of these local laws function as defacto carbon taxes. They report / monitor energy use and GHG emissions. The intent is to allow building owners to reduce their emissions by upgrading building equipment and materials, purchase renewable power offsets, and incentivize the development of renewable energy sources
Approaches to Lower Greenhouse Gas Emissions from Buildings
We must realize that the private sector’s reduction in GHG emissions will not be enough. Their efforts must be matched by the government and public utilities efforts to transition the energy grid to more renewable and low carbon sources. Only by working together can we meet the goals of the IPCC.

NYC Local Law 97 (2019)
This carbon emissions bill targets private buildings over 25,000 square feet in size. The current sources of energy in an average NYC building are from Fuel Oil, District Steam, Natural Gas, and Electricity power plants. The different sources of energy result in different GHG emissions. Please note that the Electrical emission (8.5x10⁻⁵ tons of carbon emissions per 1 kBtu of energy) is currently the worst offender of the 4 sources. Averaged across the different sources, the current average building emits 7.3x10⁻⁵ tons of carbon emissions per 1 kBtu of energy.

According to the 2019 NY State Climate Leadership and Community Protection Act, the state’s grid is required to become 70% renewable source by 2030 and 100% renewable source by 2045.
Meeting the CLCPA targets and transitioning from coal and natural gas power plants to wind, solar, and hydro sources will dramatically affect individual building’s GHG emissions.
If we take that average NYC building and hold it in place - not making any changes - and the government and power companies meet the CLCPA targets, then by 2030 the emissions will decrease from 7.3x10⁻⁵ down to 3.3x10⁻⁵ tons of carbon emissions per 1 kBtu of energy. That is 55% emissions reduction just by changing the source of energy.
Then by coupling the changes to the electrical grid with changes to building equipment and technology, then you can see how by 2050 we start to approach zero tons of carbon emissions. This mutual responsibility between the public and private efforts must both happen if we are going to bend the curve.

Now let’s layer in the effect of Passive House design on carbon emissions.
Using that same NYC Local Law 97, we can see the effect on the average building’s energy use just by increasing the mix of renewable energy sources per the CLCPA. The average NYC building constructed in 2018 uses 130 kBtu/s.f. Converted to GHG emissions that equates to .0095 with the current energy sources, and will decrease to .0051 by 2030. Local Law 97 phases in caps on carbon emissions starting at .0068 in 2024, then .0040 in 2030. You see by the graph that even in 2030, the average NYC building will still be over the emissions limit and will have to implement changes or pay a carbon penalty.
Now let’s look at a Passive House project with only uses 38 kBtu/s.f. You see that with the current energy grid, the Passive House project only emits .0028, already meeting the Local Law 97 limits for 2024 and 2030. When you factor in the government efforts to make the electrical grid cleaner, the Passive House project’s emissions drop further to .0014, meeting the 2035 Local Law estimated limit. Passive House design and concepts are a key strategy towards reducing the energy use of a building, thus drastically curbing the GHG emissions.
Using the Passive House strategy will help us bend the curve.

What is Passive House?
- The most rigorous of the energy focused building standards/certifications
- An overall holistic approach to the designing of a building that is guided by both curtailing energy usage and increasing user comfort
- A strict quality control program during construction that assures the building is assembled as designed
Why Passive House?
- Reduce carbon emissions, lower green house gasses, combat global warming.
- Reduce energy needed to operate a building by 60-80%
- Provide superior thermal comfort, indoor air quality and acoustics.
- Improve health of inhabitants
- Increase durability of building materials
- Ease compliance with government mandates (new laws, codes, standards)
How Do You Achieve Passive House?
Enclosure: Roofs, Walls, and Foundation
Provide a robust, high performance enclosure to achieve:
- Air tightness
- Windows with exceptionally low U-Values
- Continuous insulation and thermal bridge free detailing leading to high R-Values
MEP Systems
Provide a right-sized system to achieve:
- Provide a high performance, low energy heating and cooling system
- Ventilate all habitable spaces with constant fresh air with heat recovery
- Balance exhaust and supply ventilation within 10% of one another
- Specify energy efficient equipment, lighting and appliances
Passive House Institute (PHI) Performance Criteria for Certification
These are the criteria (in metric and imperial units) to achieve a passive house in NYC’s climate. This is a performance-based certification. As long as the building meets these requirements, then it is a passive house. It flexibly allows different budgets, uses, and aesthetics. If you meet these targets, you pass.

Energy Use Distribution Comparison
Comparing the typical NYC building and a Passive House one, the energy-use distribution is significantly different. In the typical building almost 50% of the building’s total energy use is for heating and cooling. With the Passive House project, not only are we using less total energy (130 EUI vs 50 EUI), but the allocation is only 11% for heating and cooling.

The Passive House strategy is very effective in reducing the heating/cooling energy use, but then what are the next targets? The biggest energy drains are now user plug loads (34%), domestic hot water demand (29%), and lighting (13%). There have been great strides made with reducing DHW and lighting loads. We tend to partner the Passive House performance standard with a prescriptive standard like LEED or Enterprise Green Communities to reduce energy consumption for DHW and lighting.
Reducing user plug loads is perhaps the most difficult to achieve, and as we become more proficient at designing efficient buildings the user plug loads will become a larger and larger proportion of the building’s energy use. Currently we are focusing on resident awareness programs and live-tracking with transparent monitoring. Most people don’t understand the relation between their choices and their energy use, the goal is to use the building as a tool to help educate and hopefully change behavior.
Doing Radically More With Radically Less
We’ve already seen how Passive House design can reduce energy use by over 60% compared to the average building. We are drastically reducing the energy consumption and GHG emissions by implementing Passive House. You may be skeptical, but we’ve seen these efforts succeed in the past:
- In the lighting industry we’ve seen 87% reduction in energy consumption by using LED technology.
- In the automotive industry, vehicle miles per gallon have increased by over 800% over the same timeframe.


The Future of Climate
Here is that “point of no return” chart. Remember, climate scientists estimate that by the year 2042, the atmosphere will reach CO2 concentration of over 450 parts per million (ppm) and this will prevent the temperature from decreasing. They have labeled this the “point of no return” and believe the effects would be irreversible.
We must bend the curve away from this point of no return.

There are 37 countries in the Organization for Economic Cooperation and Development, accounting for about 80% of global trade and investment. If the OECD countries can reduce their GHG emissions and meet their current renewable energy targets, then the curve will begin to bend. But overall this is not enough. The world total CO2 is estimates to be at roughly the same levels as today in 2020.
We must drastically bend the curve, and that involves everyone. The sustainability of the human species living on this Earth require structural changes to our energy sources, cultural attitudes, and the practices we use to construct our built environment. And as you see these changes must be delivered equitably across the world. The receding tide lowers all boats (so to speak). Only through the collective implementing of energy and carbon emissions reductions will be able to bend the curve.
Passive House Strategies
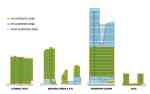
In the rest of this “Bending the Curve” series, we focus on the Passive House strategies and techniques used in the design and construction of four Handel Architects projects. Each project is quite different in appearance and budget, showing the flexibility of the Passive House standard. The projects are in different climate zones, which does change some of the Passive House energy targets. But the overall strategies are similar, even though the buildings use very different techniques.
The House at Cornell Tech in NYC and University of Toronto Scarborough Residences are student housing buildings, roughly the same area but one is high rise and the other is midrise. Sendero Verde in NYC is a three-building complex of affordable housing towers with mixed-use community facility program at the base. And Winthrop Center is a tall mixed-use tower in Boston with a Passive House office program and non-passive house residential program.

Project Challenges
Each project has unique challenges, relating to the specific site, program, budget, and year of construction. There have been supply chain issues with each our Passive House projects, although these have been decreasing over time as more products become available and cost-effective. The construction detailing is unique to each project, but less to do with Passive House requirements than the varied façade types employed on each building.

Initially we encountered code conflicts with some requirements of Passive House (like combined exhaust for centralized ERVs), but over time and in cooperation with code officials these conflicts have resolved. Each building is very densely populated, this poses challenges to accurate energy modeling and each project has a robust commissioning and post-occupancy evaluation to fine tune building operations. In general, even though all the projects are in northern climate zones, the energy consumption of the building is being driven by cooling demand loads (a function of the high-density and well-insulated air tight enclosure).
The Passive House Standard is Adaptable
The buildings’ programs require high density of occupants. Initially The House at Cornell Tech was modeled to meet PH’s 38.1 kBtu/s.f./year target. With coordination with the Passive House Institute (our PH certifier) we have been tracking the energy use and user-plug loads of the buildings. There is now a ‘density calculator’ tool in the passive house energy model to help account for the increased energy demand in densely occupied buildings. This increased density coupled with the different climate zones accounts for the difference in the energy budgets for each project. This shows how the Passive House standard is adaptable to a building’s unique program and location.

Each project’s scale and program are quite different, requiring different Passive House strategies.
For Cornell Tech and UTSC, the entire building is passive house certified with the exterior wall as the airtight enclosure. Sendero Verde has residential program in the towers and community facility tenant space at the base. The strategy for this building is to treat the entire exterior wall as the airtight enclosure, but only certify the residential spaces within that boundary. This allowed for a rigorous PH certification for the residential area, but a separated and flexible tenant experience. Winthrop Center is a large mixed-use tower with retail and public assembly at the base, office program in the middle, and residential condo at the top of the building. The passive house strategy here is to isolate the office program completely, the airtight boundary and certified spaces are completely separated in the middle of the building.
Learn more
View the next report in our series: Sustainability Report Issue #5: Why Passive House Buildings Create a Healthier Interior Environment
01
/
00